Marketing Agency Reporting & Analytics: The Complete Dashboard Guide for Agencies
No marketing agency suffers from a lack of data. Between SEO software, Google Ads, Meta Ads, GA4 and a CRM, there's far more of it than any client would ever be willing to read. The problem was never gathering the numbers — it's producing a report that answers the only question the client actually has: is it working, and what happens next?
That's the gap a proper marketing agency reporting dashboard is built to close.
What Marketing Agency Reporting Really Is
Good agency reporting isn't a table of numbers. It's a process, and it's worth being precise about the stages, because reports that stop early are exactly the ones clients dismiss as busywork.
- Data — the raw numbers from each channel.
- Metrics — clicks, leads, spend, conversions.
- Insights — what those numbers actually mean.
- Recommendations — what to do differently next month.
- Decision — what the client, or the agency, does about it.
A report tells the client what happened. Analytics explains why it happened and what to do next. Most agencies never make it to that last stage — which is precisely why so many clients treat reporting as "proof of work" rather than something that helps them decide anything.
Why Agencies Need a Centralised Dashboard
Checking your SEO rankings in one platform, ad performance in another, lead data in a third, then stitching it all together in a spreadsheet by hand — it's slow, it invites errors, and it still never quite shows how the channels connect to each other.
That's exactly the problem the Dashient Reporting Dashboard is built to solve. Instead of exporting screenshots from five different platforms, everything is consolidated into one live dashboard that the agency and the client both read the same way.
The Essential Sections of a Reporting Dashboard
A clear dashboard rarely needs more than four or five sections.
1. Executive Overview
Traffic, leads, clients and revenue at a glance — the numbers a business owner actually cares about.
2. SEO Performance
Organic clicks, impressions, average position, top landing pages and organic conversions. Where a client is investing in local visibility too, this is where local SEO performance — map-pack rankings, calls and direction requests — belongs, alongside the national SEO picture.
3. Paid Advertising
Spend, clicks, CPC, leads and cost per lead — shown against the campaign's actual goal rather than in isolation. This is where managed Google and Meta Ads get judged on outcomes, not impressions.
4. Lead Funnel & Attribution
This is where reporting becomes genuinely useful: which channel a lead came from, and how it moved from enquiry to qualified lead to client. Getting lead attribution right stops agencies — and clients — crediting the wrong channel for a sale, and it's usually the section clients ask the most questions about.
SEO vs Paid Ads: Different Channels, Different KPIs
SEO and PPC shouldn't be judged by the same KPIs. Organic clicks, average position and backlinks tell you how SEO is performing; CPC, budget spent and return on ad spend (ROAS) tell you how paid ads are doing. Reporting them against the same yardstick flatters one and unfairly punishes the other. Where cost feeds the decision on where to invest, it's worth setting realistic SEO pricing in the UK against expected ad spend, so budget calls rest on real numbers rather than guesswork.
Turning Dashboard Data Into Actual Insight
The difference between a report and a useful report is interpretation. Compare two statements:
- "Organic traffic is up 20%."
- "Organic traffic is up — but impressions have grown faster than clicks, which means there's room to lift click-through rate on the pages that already rank."
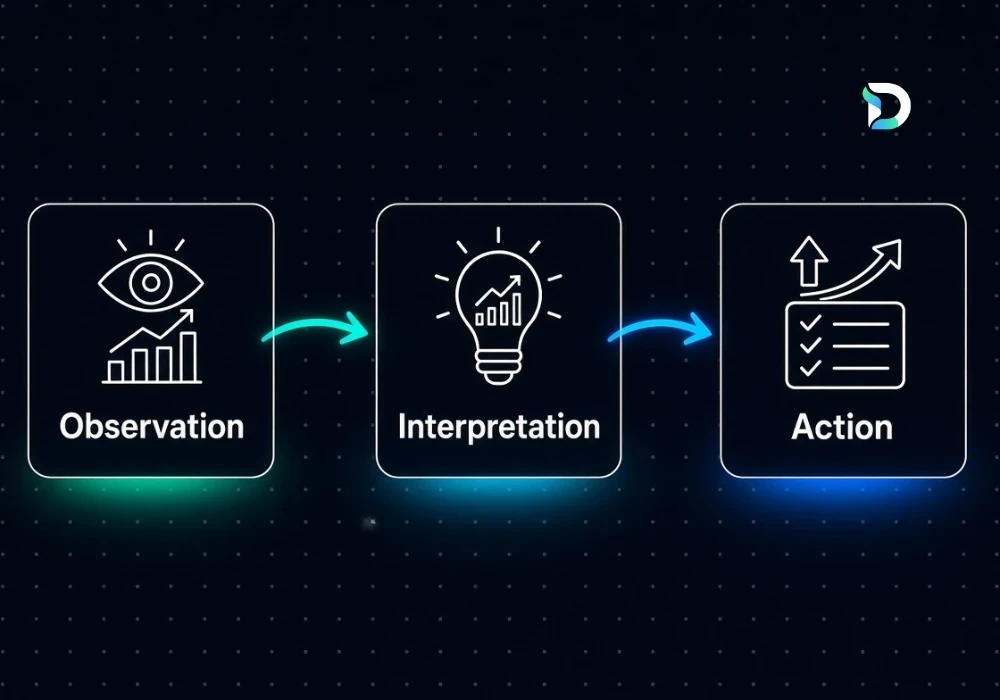
The first is a number. The second is a decision waiting to happen. It's one small change of format, and every section of a report benefits from the same three-step shape: observation, interpretation, action.
Common Agency Reporting Mistakes
- Reporting too many numbers with no order of priority.
- Vanity metrics with no connection to a business outcome.
- No benchmark period, so there's no way to tell growth from decline.
- No attribution context — leads appearing with no source attached.
- Reporting numbers with no recommendation next to them.
- Rebuilding by hand, every month, reports that could be automated.
Automated vs Manual Reporting
Manual reporting — spreadsheets, screenshots, copy-paste — eats hours every month and drifts between reports, so no two ever quite line up. A connected dashboard pulls from live data sources, updates daily, and gives the agency and the client the same view — without removing the human analysis that turns numbers into recommendations. It's the shift from raw BI software toward managed, cross-channel reporting delivered as a service.
One Live View Across Every Channel
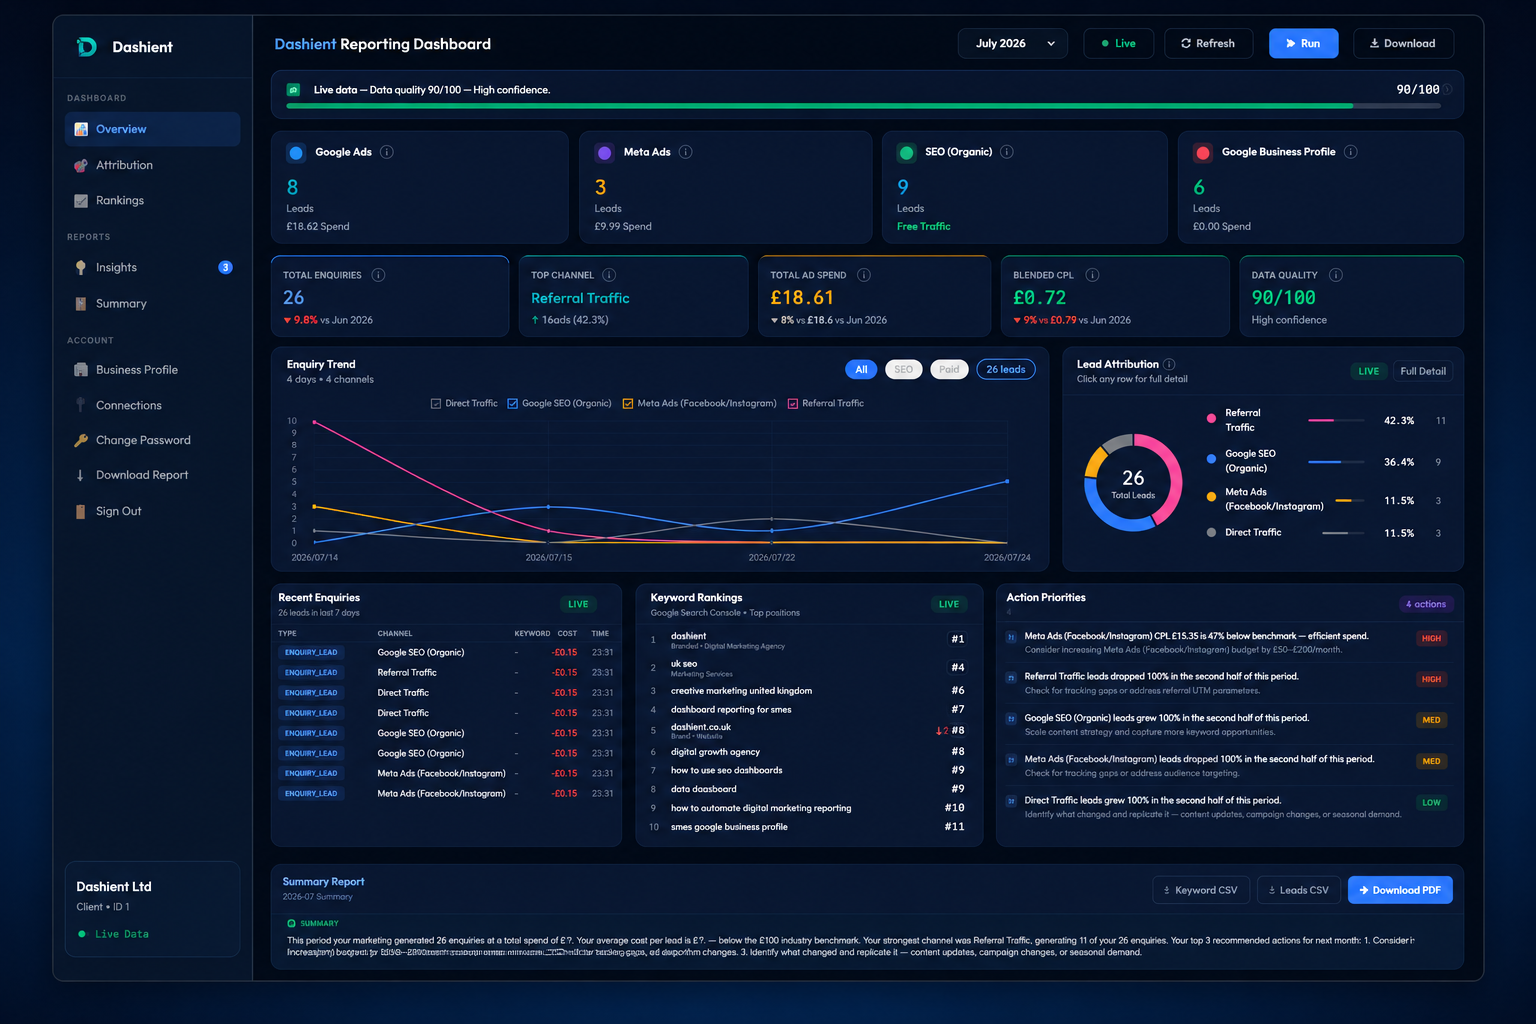
This is where a lot of UK agencies hit a wall — not because they lack data, but because it's scattered across a CRM, an ads platform and an analytics tool that don't talk to each other. The Dashient Reporting Dashboard (DRD) is built to close that gap. It connects Google Ads, Meta Ads, GA4, Search Console and Google Business Profile into one connected view, and matches enquiries — forms, click-to-call taps and direction requests — back to the channel that actually produced them, using multi-touch attribution rather than crediting only the last click.
It refreshes daily and calculates blended cost per enquiry across channels, so client reviews start from one agreed number instead of five conflicting exports. For the agency-specific picture of how this changes ROI reporting, see our guide to marketing agency reporting tools.
Why Tracking Enquiries Alone Isn't Enough
Enquiry volume is the easiest number to put in a report and, on its own, one of the least useful. The channel that generates the most enquiries often isn't the one producing the most clients per pound. The figures below are illustrative only, not real client data, but they show why a per-channel view beats a single total:
| Channel | Enquiries | Cost per enquiry | Clients won |
|---|---|---|---|
| Google Ads | 42 | £22 | 6 |
| Meta Ads | 31 | £18 | 3 |
| SEO (organic) | 28 | Lowest (compounds over time) | 8 |
| Google Business Profile | 19 | £4 | 5 |
| Referral / direct | 12 | — | 4 |
Google Ads leads on raw enquiries, but organic and Google Business Profile quietly convert more of them into clients at a fraction of the cost. An enquiry total hides that entirely; a channel-by-channel dashboard is what surfaces it.
How SEO, Paid Ads and Reporting Work Together
Acquisition, measurement and interpretation aren't separate systems — they're one connected pipeline. SEO, Google Ads and Meta Ads and local search bring the traffic; the dashboard ties every enquiry back to the channel that produced it; and the analysis decides what to change next month. Treat any one stage in isolation and you'll optimise a part of the picture while the rest quietly misleads the client.
Frequently asked questions
Final Thoughts
Enquiry counts feel like progress, but they aren't the goal — clients, revenue and clear decisions are. A dashboard that explains why results moved, which channels did the work, and what to do next will consistently outperform one that only reports what happened. For UK agencies handling SEO, paid ads, local listings and leads across many clients, that's where reporting stops being a monthly chore and becomes a means of growth.
If you'd like to talk through how this would work for your agency and your clients, get in touch and book your free growth audit — we'll walk you through your options. You can also follow Dashient on Facebook and LinkedIn.