I Analysed 50 UK Business Dashboards — Here's What Vanity Metrics Hide
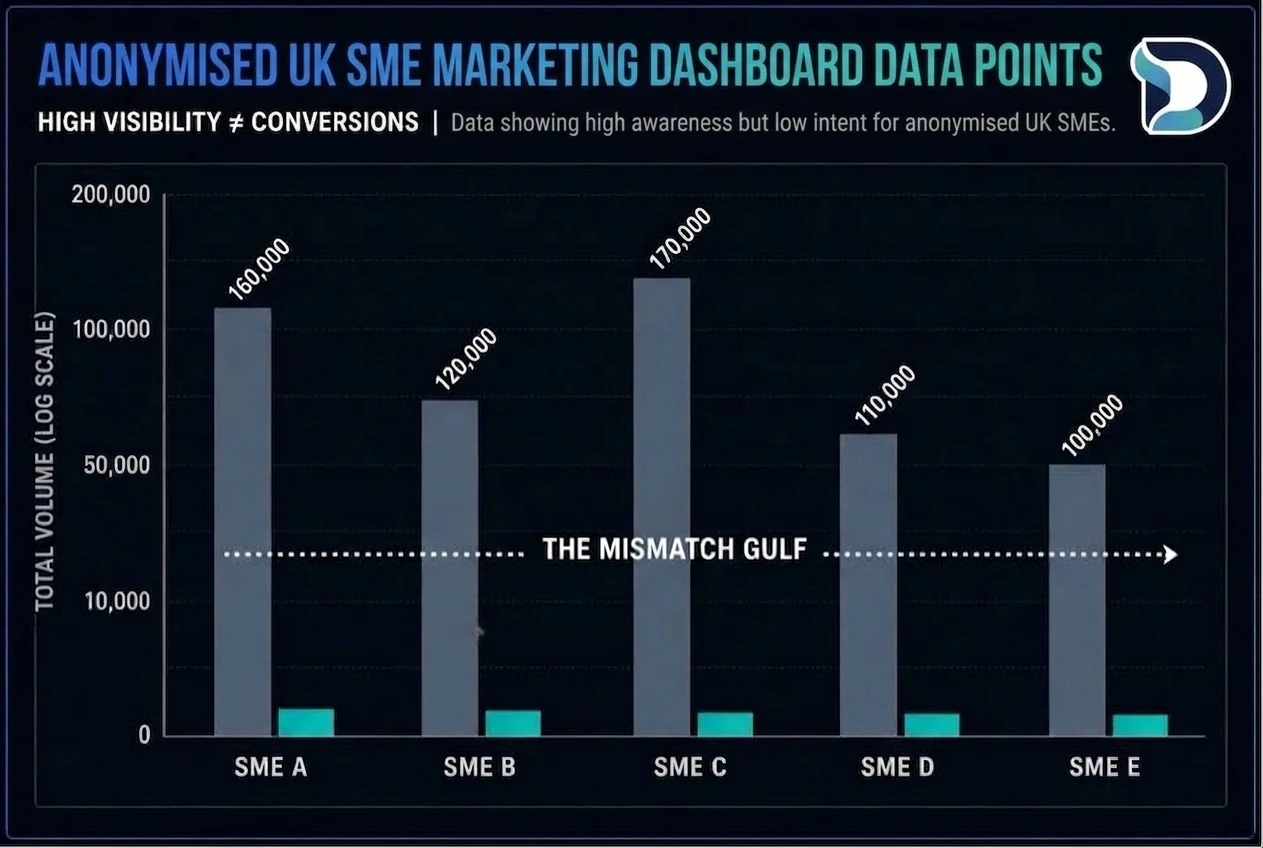
Every week, UK SME owners log into their marketing dashboard and get the same comforting view: rising impressions, more followers, clicks trending up. It all looks like progress. But when I took the time to analyse 50 genuine UK SME marketing dashboards, one thing came up again and again — the figures that impress everyone in the report rarely matched the real number of enquiries received.
Here's what those 50 dashboards taught me about vanity metrics, and how to spot them in your own reports before they cost you.
What Are Vanity Metrics in Marketing?
Vanity metrics are figures that look good on paper but tell you nothing about your revenue, your enquiries, or your actual growth. Impressions, likes, page views and followers are the classic examples. They're popular in marketing reports for one reason: they're easy to measure and easy to present.
The problem is that vanity metrics answer the wrong question. A business owner doesn't need to know how many people saw an ad — they need to know how many people called, submitted an enquiry, or asked for a quote.
Marketing Dashboard Case Study: What 50 UK SMEs Revealed
Over several weeks, I reviewed marketing dashboards from 50 real UK small businesses across trades, professional services and retail. The data below is anonymised, but the pattern was consistent enough to be worth sharing:
| Business | Impressions | Enquiries |
|---|---|---|
| Plumbing firm, Leeds | 18,400 | 3 |
| Dental practice, Manchester | 32,000 | 5 |
| Accounting firm, Birmingham | 20,000 | 2 |
| Roofing contractor, Bristol | 9,600 | 11 |
| Estate agency, London | 41,000 | 4 |
The one to notice is the roofing contractor in Bristol. It had the fewest impressions of the group, yet the most enquiries — because its campaigns were built around intent and lead attribution, not pure reach. Compare that to the estate agency in London: more than four times the impressions, but roughly a third of the enquiries. Ranked by impressions, you'd have called the wrong campaign the winner.
Vanity Metrics vs Real Metrics: Examples
Here's a simple way to tell the two apart:
| Vanity metric | What it tells you | Real metric | What it actually tells you |
|---|---|---|---|
| Impressions | Reach | Enquiries | Genuine interest |
| Likes / followers | Social approval | Cost per enquiry | Efficiency of spend |
| Click-through rate (alone) | Curiosity | Conversion rate | Buying intent |
| Page views | Traffic volume | Qualified leads | Sales-readiness |
None of the vanity metrics are useless on their own — impressions still matter for brand awareness, and clicks show interest. The problem is when they're presented as proof of business growth, without ever being connected to enquiries or revenue.
Why Impressions Don't Mean Sales
Impressions count how many times an ad was shown — not who saw it, whether they were the right audience, or what they did next. A small business advertising locally in the UK will rack up tens of thousands of impressions from people in the wrong location, the wrong demographic, or just scrolling past. Across the 50 dashboards, the businesses with the most enquiries didn't have the biggest reach — they had lead attribution, and could tie each enquiry back to a specific campaign, keyword or channel.
Cost Per Enquiry vs Impressions: Which Actually Matters
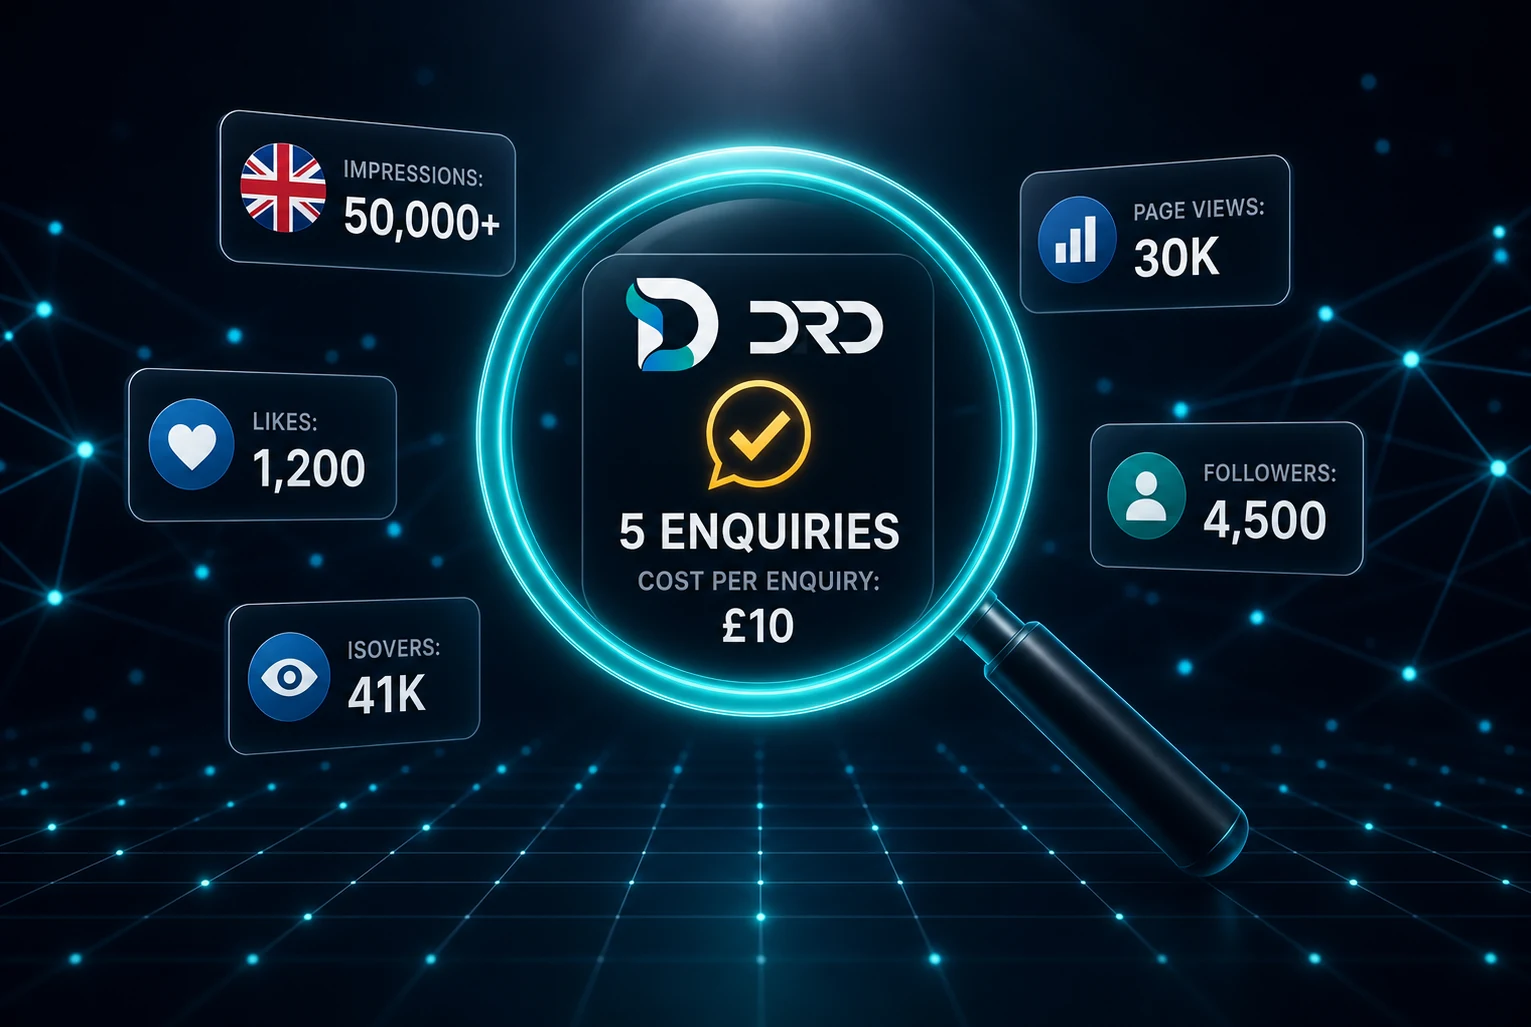
If you can only track one number, make it cost per enquiry. It answers the question every SME owner actually cares about: what am I paying to get someone interested enough to contact me?
Impressions can climb while cost per enquiry quietly gets worse — meaning you're spending more to get the same (or fewer) real leads. That's the trap: the dashboard looks healthier while the return on spend is actually shrinking.
How to Spot Vanity Metrics in Your Marketing Reports
Run the numbers in your next report through this checklist:
- Does it drive money into your account? Any metric that can't be connected to an enquiry, sale or booking is context — not a result.
- Is there a cost next to it? A metric reported without a cost figure (CPC, cost per enquiry) is usually there to look good, and nothing else.
- Is attribution missing? If your report can't tell you how an enquiry came about, the top-line numbers are unverifiable.
- Are you shown trends, or just snapshots? "Record impressions" in a single month means little without cost per click and conversion rate beside it.
- Are the numbers suspiciously round? Very neat figures (impressions in tidy tens of thousands, likes in round hundreds) are often vanity metrics dressed up.
How the Dashient Reporting Dashboard (DRD) Fixes This
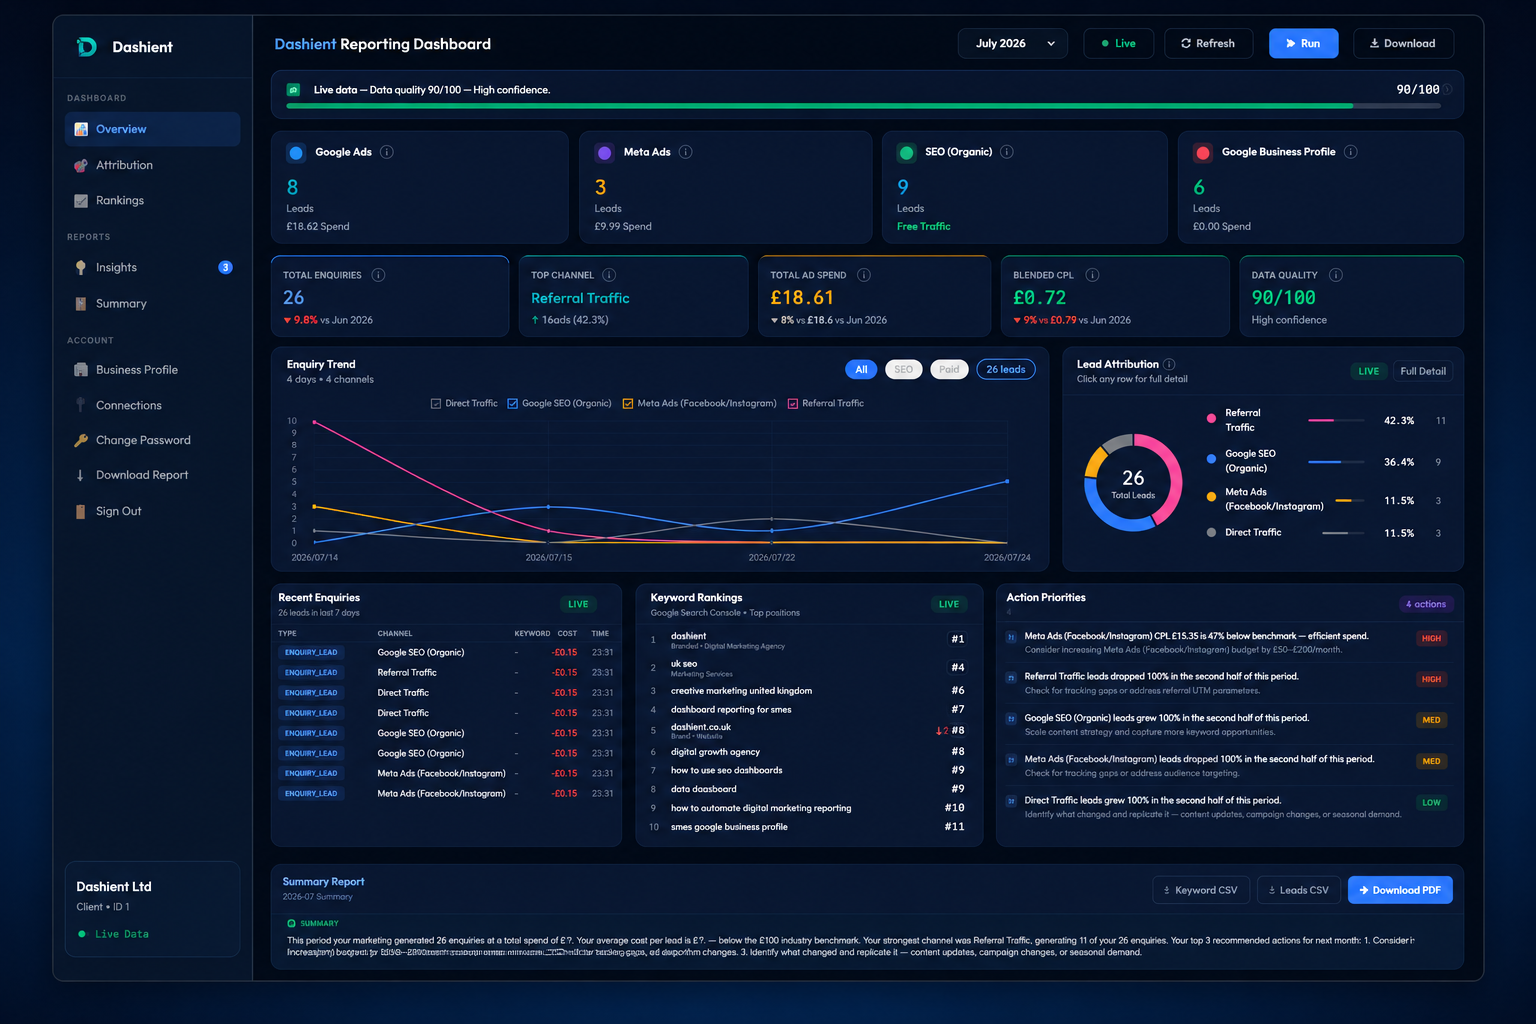
This is exactly what the Dashient Reporting Dashboard (DRD) was built to fix. DRD links Google Ads, Meta Ads, GA4, Search Console and Google Business Profile through one Google login and one Meta login — a setup that takes 1–3 hours across two calls, not months of a data project.
Every enquiry — form submission, call, or direction request — is traced back to its source and given weighted credit across the full journey, not just the last click. Your dashboard updates daily, so you know which channel is genuinely producing leads this week, not last month. It's designed to work alongside your current process, not replace it — you can see exactly how it works here.
Fixing the Problem: Lead Attribution for UK SMEs
The businesses in this study that avoided the vanity-metric trap all had one thing in common: proper lead attribution. For every enquiry, they knew which channel, campaign or keyword produced it — not just that "marketing" did.
If you're not sure where your leads are actually coming from, our best lead source checklist walks through exactly how to set this up for a UK SME, step by step. And if your current reports are heavy on impressions and clicks but light on enquiries and cost data, it's worth reading how to tell which reporting numbers you can actually trust.
Frequently asked questions
Final Thoughts
Across all 50 UK dashboards, the message was the same: bigger figures don't always mean bigger outcomes. Impressions, likes and page views can make a dashboard look good on the surface, but the numbers that actually make money are the enquiries. The fix isn't to ignore the vanity metrics — it's to understand what sits behind them, and to put proper lead attribution in place.
If you'd like a second pair of eyes on your own dashboard, the Dashient team can show you which numbers to trust and which ones are quietly hiding the truth. Book Your Free Growth Audit — we'd love to help you see your marketing clearly. You can also follow Dashient on Facebook and LinkedIn.