Real-Time Analytics vs PDF Reporting: Key Differences & Examples
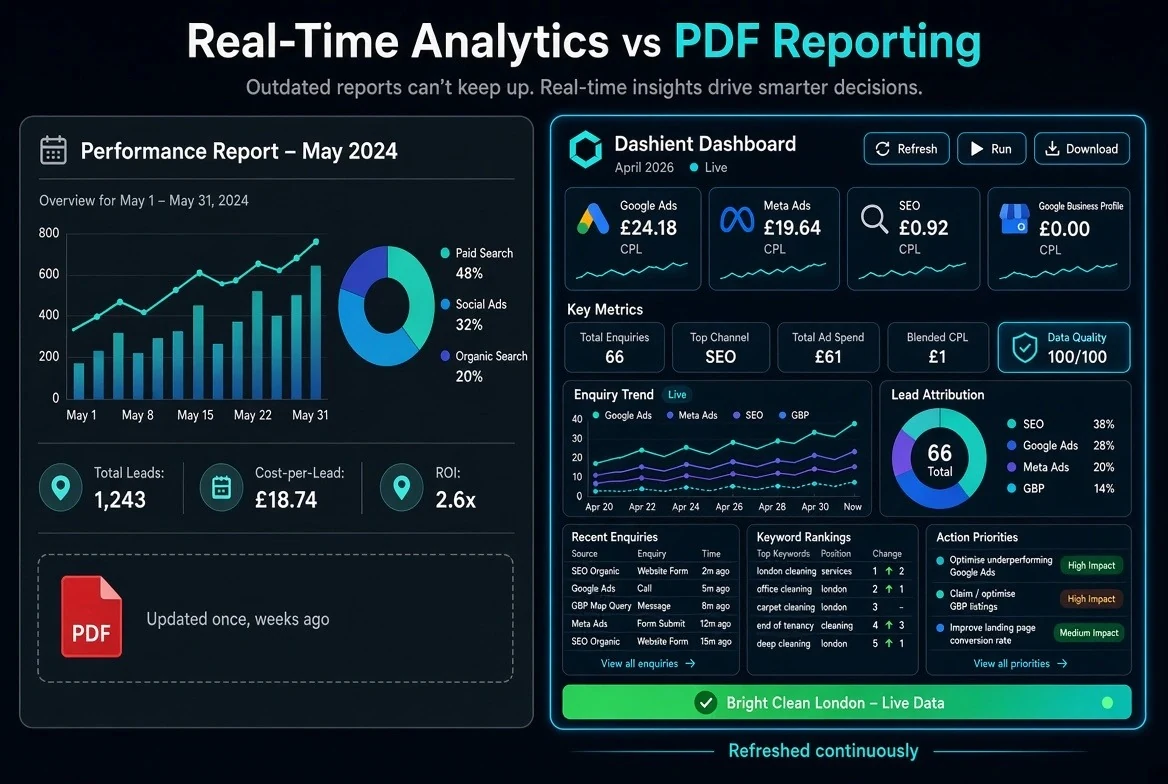
If your marketing agency still emails you a PDF once a month, you're making decisions on data that's already three to four weeks old by the time you open it. That gap is exactly why so many UK service businesses are switching from static reporting to real-time analytics — and it's the difference we'll break down in this guide, with real examples of what each approach looks like in practice.
What Is Real-Time Analytics?
Real-time analytics is the continuous collection and display of marketing and enquiry data as it happens, rather than in a batched, once-a-month summary. Instead of waiting for a report, you log into a live dashboard and see today's enquiries, this week's ad spend, and this month's cost per lead — updated automatically, not manually compiled.
For a UK service business, this typically means Google Ads, Meta Ads, GA4, Google Search Console and Google Business Profile data flowing into one connected view, refreshed daily rather than monthly.
What Is PDF Reporting?
PDF reporting is the traditional agency model: someone manually pulls numbers from several platforms, drops them into a template, and emails it to you around the same time each month. It looks tidy, but it's a snapshot of the past — by the time you're reading about last month's Google Ads performance, this month's budget has already been spent.
Real-Time Analytics vs PDF Reporting: The Key Differences
Here's how reporting vs real-time analytics actually compares when you line them up side by side:
- Freshness — A PDF report is a static snapshot, often 20–30 days old. A real-time analytics dashboard reflects today's data, so a dip in leads gets caught this week, not next month.
- Attribution accuracy — PDFs usually report platform-level numbers (impressions, clicks, "reach"). A proper marketing reporting dashboard UK businesses actually need should show real enquiries — form fills, phone calls, direction taps — attributed back to the channel that drove them.
- Marketing ROI visibility — With PDF reporting, you're trusting a summary written by the agency itself. With real-time analytics, you can calculate your own blended cost-per-enquiry and marketing ROI directly from the source data, any day you like.
- Speed to action — A monthly PDF means a monthly reaction time. A real-time dashboard your team can check daily means underperforming campaigns get paused in days, not weeks.
- Data consolidation — PDFs are often stitched together from five separate spreadsheets and tools. A unified data analytics dashboard pulls Google Ads, Meta, GA4, Search Console and GBP into one place automatically.
Example: PDF Reporting vs the Dashient Reporting Dashboard (DRD)
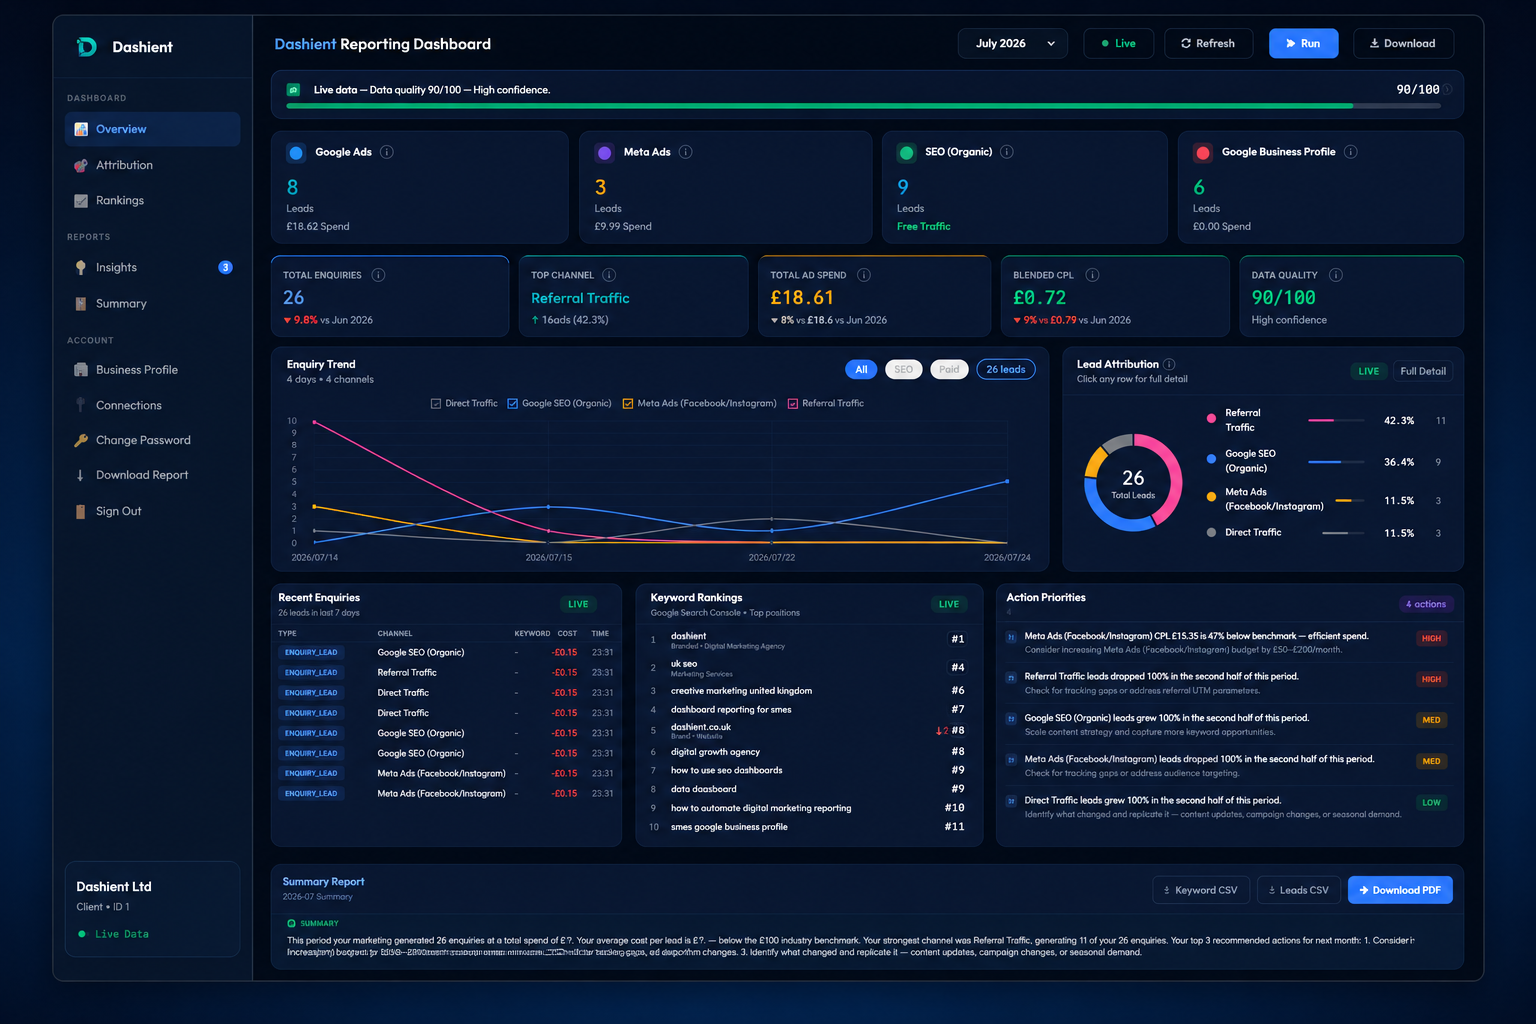
To make this concrete, here's what the difference looks like in practice with our own lead attribution tool, the Dashient Reporting Dashboard (DRD).
A typical PDF report tells you Google Ads generated 4,200 clicks and Meta generated 96,000 impressions this month. That's activity, not outcomes — it doesn't tell you how many of those clicks or impressions actually turned into an enquiry, or what each enquiry cost you.
The Dashient Reporting Dashboard instead joins Google Ads, Meta, GA4, Search Console and Google Business Profile against your real enquiries — form submissions, click-to-call taps and direction requests — and updates daily. Instead of vanity metrics, you see:
- Which channel actually introduced the buyer, and which one just closed them (multi-touch attribution, not last-click guesswork).
- Blended cost-per-enquiry across paid, organic and local — calculated live, not estimated once a month.
- Weekly flags on campaigns, pages and search terms that moved up or down, so you know exactly where to spend your review time.
It's built specifically to answer the question a PDF report can't: which pound of marketing spend actually turned into a real enquiry?
Why This Matters for UK Service Businesses
Most UK service businesses don't have a marketing team sat behind five different dashboards cross-checking numbers — they have a business to run. A digital marketing dashboard UK owners can actually use needs to answer one question in seconds: is this month's marketing spend bringing in real leads, or not?
That's also why lead attribution has become such a hot topic for UK businesses — last-click reporting routinely hides which channel actually started the enquiry. We cover this in more depth in Lead Attribution 101: Track Every Enquiry, and if you're still not sure where your leads are actually coming from, this guide walks through how to find out.
Frequently asked questions
The Bottom Line
PDF reporting isn't wrong — it's just outdated for how fast marketing moves. Real-time analytics gives you the same information, plus the freshness and attribution accuracy needed to act on it, rather than just reading about it a month late. If your current reporting still arrives as a static file once a month, it's worth seeing what a live dashboard shows instead.
Book a free audit with Dashient and see your real enquiry data, live — not next month's PDF. You can also follow Dashient on LinkedIn and Facebook.