Multi-Source Lead Attribution for UK Service Businesses: A Practical Guide
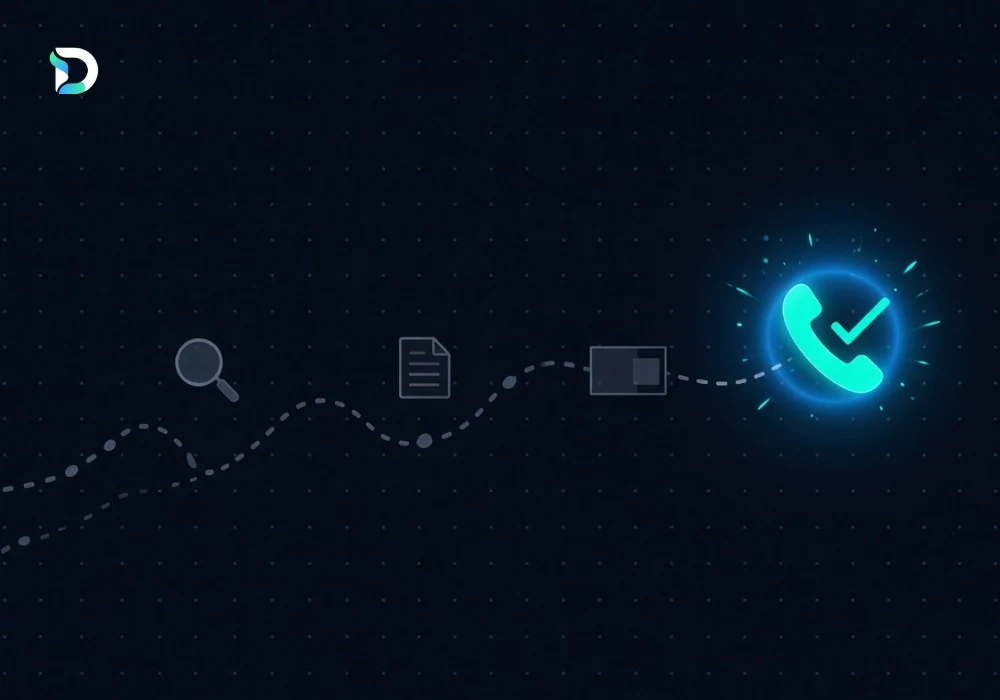
Ask most UK service business owners where their leads come from and you'll get an honest shrug — not because they aren't paying attention, but because the answer genuinely isn't obvious. A customer reads a blog post on Tuesday, sees a Meta ad on Thursday, searches your company name the following week, taps your Google Maps listing and rings you from the car park. Four sources, one enquiry. So which one earned it?
That question sits at the heart of multi-source lead attribution — and for service businesses running more than one channel, getting it wrong is expensive.
What Multi-Source Lead Attribution Actually Means
Multi-source (or multi-touch) attribution means accounting for every marketing touchpoint involved in generating an enquiry, rather than handing all the credit to whichever one happened to be last. It recognises something most reporting tools ignore: people make buying decisions across several visits, several channels, and sometimes several weeks.
This matters because single-touch attribution doesn't just simplify the picture — it distorts it, in favour of whatever channel sits nearest the conversion point.
The Lead Sources UK Service Businesses Need to Track
Organic search and SEO
Blog posts and service pages often start journeys rather than finish them. Track landing pages, organic conversions and — crucially — what happens to those leads after they enter your pipeline. This is the on-page SEO work that seeds the top of the funnel.
Google Ads
The easiest channel to measure, and therefore the one most likely to be over-credited. Look past clicks and cost-per-click to cost per qualified lead.
Meta Ads
Rarely the last click, frequently the first. Meta ads often introduce a business to someone who converts through search days later — which is exactly the contribution last-click reporting erases.
Google Business Profile and Maps
For local service firms this is often the highest-volume source of phone calls, and the most commonly miscredited — because the customer may have discovered you somewhere else entirely.
Direct traffic
Direct almost never means "came out of nowhere." Someone typing your URL learned your name somewhere. Treat large direct numbers as a tracking gap, not a channel.
Referrals
Trade directories, partner sites and industry publications. Low volume, often high intent.
Why Last-Click Reporting Misleads Service Businesses
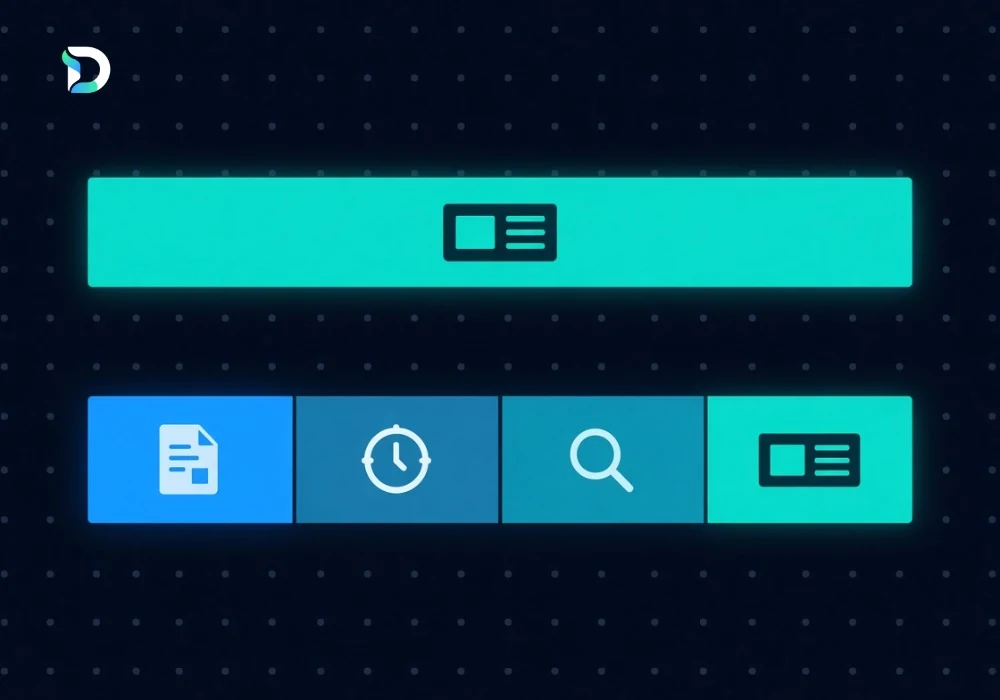
Picture a commercial roofing company in Manchester. A facilities manager finds its guide to maintaining flat roofs through an organic search. Two weeks later, they come across a Meta ad. The following week they search the company by name, click a Google Ad, and dial the number on the Maps listing.
Last-click attribution records only one thing: a call from Google Business Profile. The SEO guide that built the trust, and the Meta ad that kept the company in mind, are credited with nothing at all — even though, remove either one, and the enquiry never happens.
From Lead to Revenue: The Part Most Reporting Skips
Lead volume on its own is a vanity metric. Forty enquiries from one channel and fifteen from another tells you very little if the fifteen convert at three times the rate and carry higher contract values.
A useful attribution system tracks the full chain — enquiry, qualified lead, quote issued, customer won, revenue. Only at the revenue layer do the genuine differences between channels become visible.
| Metric | What it tells you |
|---|---|
| Lead source | Which channel initiated contact |
| Total enquiries | Raw demand generated |
| Qualified leads | Whether the leads are worth having |
| Customers won | Actual commercial outcome |
| Revenue by source | Which channels fund the business |
| Cost per qualified lead | True efficiency, not surface efficiency |
Building a Multi-Source Attribution System
- Define your lead sources explicitly, including phone and offline routes.
- Standardise UTM parameters across every campaign, on every platform.
- Track form submissions, click-to-call taps and direction requests as distinct actions.
- Connect website analytics to your CRM so leads can be followed to outcome.
- Agree clear stage definitions: enquiry, qualified, opportunity, customer.
- Choose a multi-touch model that reflects your real sales-cycle length.
- Bring everything into one dashboard rather than five separate reports.
Where the Dashient Reporting Dashboard Fits
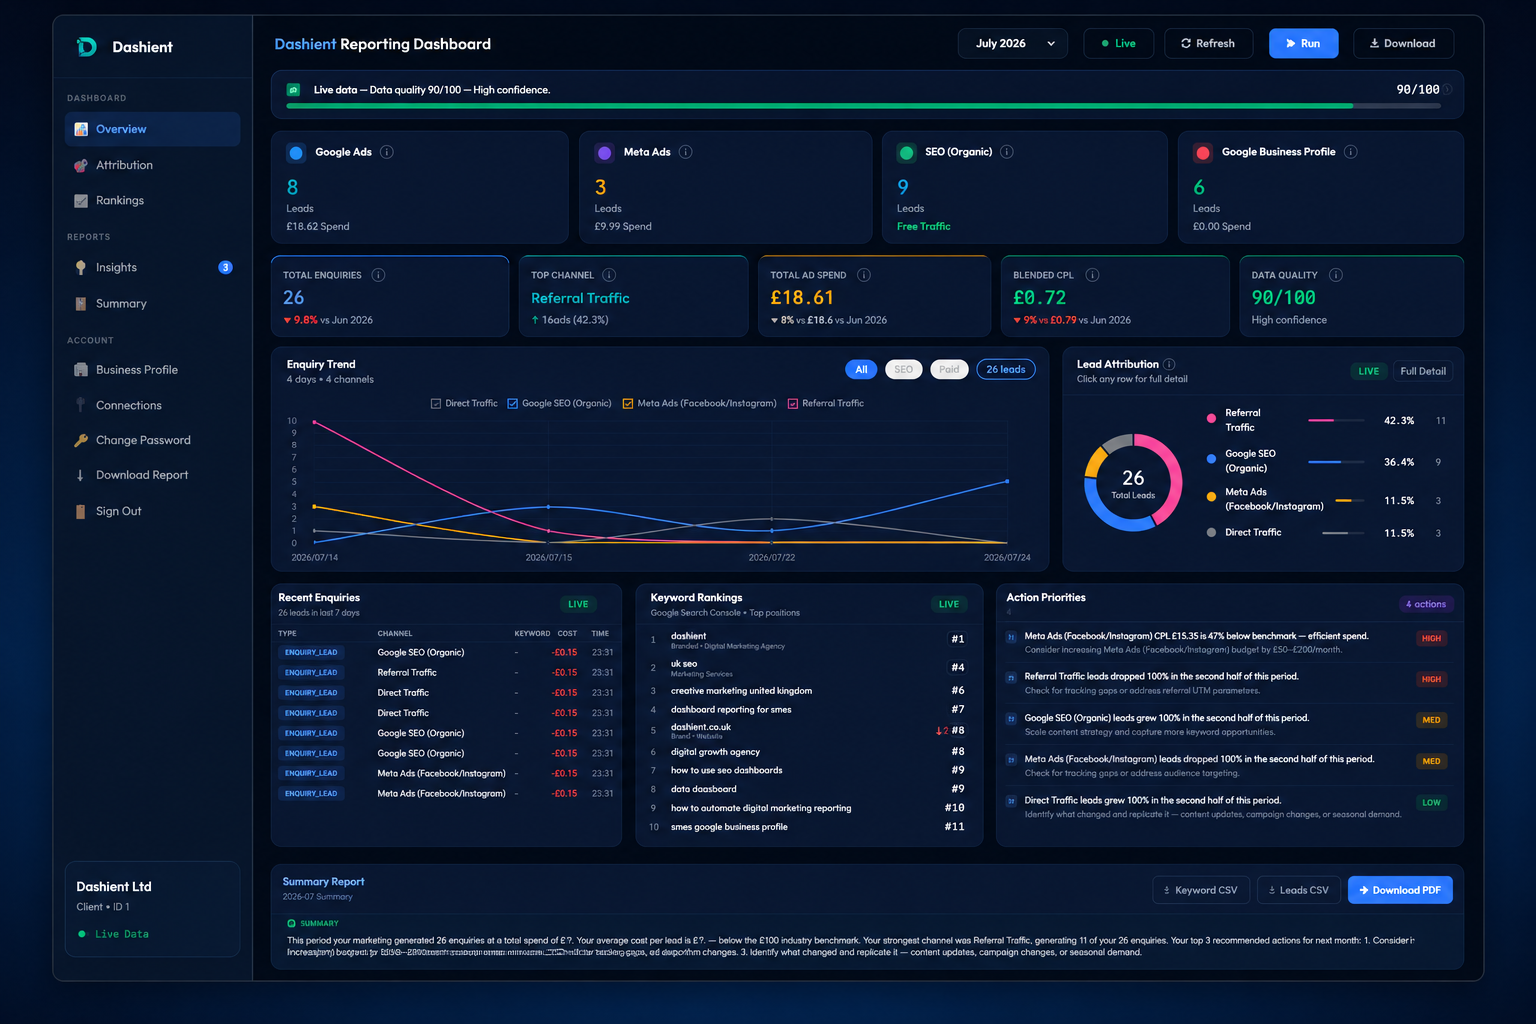
Doing all of the above manually means exporting from Google Ads, Meta Ads, GA4, Search Console and Google Business Profile every month and hoping the numbers reconcile — which they rarely do. The Dashient Reporting Dashboard (DRD) is built specifically for UK service businesses facing exactly this problem.
It connects those five sources into a single view, then matches every enquiry — forms, click-to-call taps and direction requests — back to the channel that genuinely produced it, using multi-touch attribution rather than last click alone. So instead of Google Business Profile absorbing credit for a lead that began with a Meta ad and an SEO article, you see the real path. Blended cost per enquiry is calculated across paid, organic and local together, the dashboard refreshes daily rather than arriving as a monthly PDF, and setup typically takes a couple of hours across two short calls. It's also designed to sit alongside done-for-you SEO and Google/Meta Ads management, so the campaigns, the tracking and the reporting all work from the same set of enquiries — rather than three conflicting versions of the truth.
Common Attribution Problems
- Phone calls treated as unattributable and left out of reporting entirely.
- Missing or inconsistent UTM tagging across platforms.
- CRM data sitting completely disconnected from marketing data.
- Duplicate leads counted once per platform.
- Judging channels on lead volume rather than closed revenue.
- Assuming platform-reported conversions from different tools can simply be added together.
Accepting the Limits
No attribution system is complete. Cross-device journeys break, privacy controls limit tracking, some conversations happen offline, and a recommendation from a neighbour will never appear in any dashboard. The goal isn't perfect data — it's data good enough to stop making budget decisions on guesswork.
Frequently asked questions
Final Thoughts
Multi-source attribution isn't an analytics luxury for large firms. For a UK service business spending across search, social and local, it's the difference between knowing which channels build the pipeline and cutting the one that quietly does the heavy lifting. Start by tracking calls properly, connect your CRM, and judge channels on revenue rather than enquiry counts.
If you'd like to talk through which package fits your business, get in touch and book your free growth audit — we'll walk you through your options. You can also follow Dashient on Facebook and LinkedIn.